The FAIR model for cloud security: putting a dollar value on your attack surface
Every cloud security tool produces a list of findings ranked by CVSS score. Critical findings go to the top of the queue; engineers fix them in order. This approach has an intuitive appeal — surely the highest-severity vulnerability is the most urgent.
The problem is that CVSS measures the exploitability and impact of a vulnerability in isolation. It does not know whether your environment has compensating controls. It does not know whether the vulnerable resource is a developer's test server or your payment processing API. It does not know whether you process ten thousand transactions per day or ten million. Two organisations with identical CVSS scores can face risks that differ by three orders of magnitude.
FAIR — Factor Analysis of Information Risk — is the framework that fills this gap. It does not replace CVSS. It uses it as one input in a model that produces what your board actually cares about: the dollar value of your attack surface.
The developer server vs. the payment processor
Consider two findings, both rated CVSS 9.1 (Critical):
- An unauthenticated RCE vulnerability in a web framework running on a developer's personal EC2 instance used for feature testing. The instance has no production data and can only be reached from the corporate VPN.
- The same vulnerability in the same web framework running on the API servers that process payment authorisations for your e-commerce platform, directly accessible from the internet.
CVSS says these are equivalent. Any security engineer knows they are not. FAIR makes that difference numerically explicit.
FAIR fundamentals: frequency times magnitude
FAIR models risk as the product of two variables: Loss Event Frequency — how often will a loss event occur? — and Loss Magnitude — how much will it cost when it does?
Loss Event Frequency has two components:
- Threat Event Frequency — how often will a threat actor attempt to exploit this?
- Vulnerability — when a threat actor attempts exploitation, what is the probability of success?
Loss Magnitude breaks down into primary and secondary losses:
- Primary losses — incident response costs, forensics, data recovery, business downtime.
- Secondary losses — regulatory fines, legal liability, reputation damage, customer churn.
The model is probabilistic — each variable is expressed as a range with a confidence interval, and Monte Carlo simulation produces a distribution of annualised loss exposure (ALE) rather than a single point estimate. This is important: it makes uncertainty explicit rather than hiding it behind a precise-looking score.
How Onam automates FAIR inputs
The traditional objection to FAIR is that it requires too many manual inputs to scale. Estimating threat event frequency for a specific vulnerability in a specific environment has historically required expert judgment for every finding. Onam automates the inputs where data is available.
Threat probability from KEV and EPSS. The CISA Known Exploited Vulnerabilities (KEV) catalog identifies vulnerabilities that have been actively exploited in the wild. FIRST's Exploit Prediction Scoring System (EPSS) provides a 30-day probability that a given CVE will be exploited. For a CVE on the KEV list with EPSS above 0.5, we set the threat event frequency high — this is a vulnerability attackers are actively targeting. For a CVE with EPSS below 0.01, the frequency is set low regardless of CVSS score.
Vulnerability score from compensating controls. A CVSS 9.1 vulnerability behind a WAF that blocks known exploit patterns is harder to exploit than the same vulnerability with no WAF. A public-facing resource is more vulnerable than one protected by VPN. Onam maps each finding's network exposure, WAF configuration, and authentication state to adjust the vulnerability component of the FAIR model.
Loss magnitude from industry benchmarks. IBM Cost of a Data Breach and Ponemon Institute publish per-record breach cost estimates by industry:
| Industry | Cost per exposed record |
|---|---|
| Healthcare | $499 |
| Financial services | $183 |
| Retail | $105 |
For a finding that exposes customer PII, Onam uses the record count (or an estimate based on database size), the industry classification, and the data sensitivity tier to compute a baseline loss magnitude.
Regulatory fine projections
Secondary losses from regulatory exposure are often larger than primary incident response costs. Onam projects three regulatory fine structures for findings that involve personal data:
| Framework | Fine structure |
|---|---|
| GDPR | Up to €20M or 4% of global annual revenue, whichever is greater — a €2M cap per incident for a mid-size SaaS company with €50M revenue |
| HIPAA | $1.9M per violation category per year for wilful neglect; settlements for large breaches have reached $16M (Anthem) and $5.5M (Memorial Healthcare System) |
| PCI-DSS | $5,000–$500,000 per month for non-compliance, plus per-transaction liability after a breach; post-breach assessments average $1.2M for mid-tier merchants |
These fine projections are added to the loss magnitude estimate and allocated to each finding that contributes to the regulatory exposure. A single RDS database with unencrypted customer PII carries not just the breach cost of the records it contains, but a proportional share of the potential regulatory liability.
Crown jewel risk multipliers
Standard FAIR analysis treats all resources of a given type equivalently. Crown jewel analysis applies multipliers that reflect the actual business value of specific resources.
A resource is designated as a crown jewel — and its risk magnitude multiplied — based on:
- Whether it is tagged as production and sensitive.
- Whether it is the endpoint of attack paths that reach other high-value resources.
- Whether it processes financial transactions, health records, or PII at scale.
- Whether it hosts intellectual property — source code, model weights, proprietary datasets.
The multiplier for a crown jewel finding ranges from 2x to 10x the base loss magnitude, depending on how central the resource is to your business operations and the sensitivity of the data it holds.
Converting a finding list into a ranked remediation queue
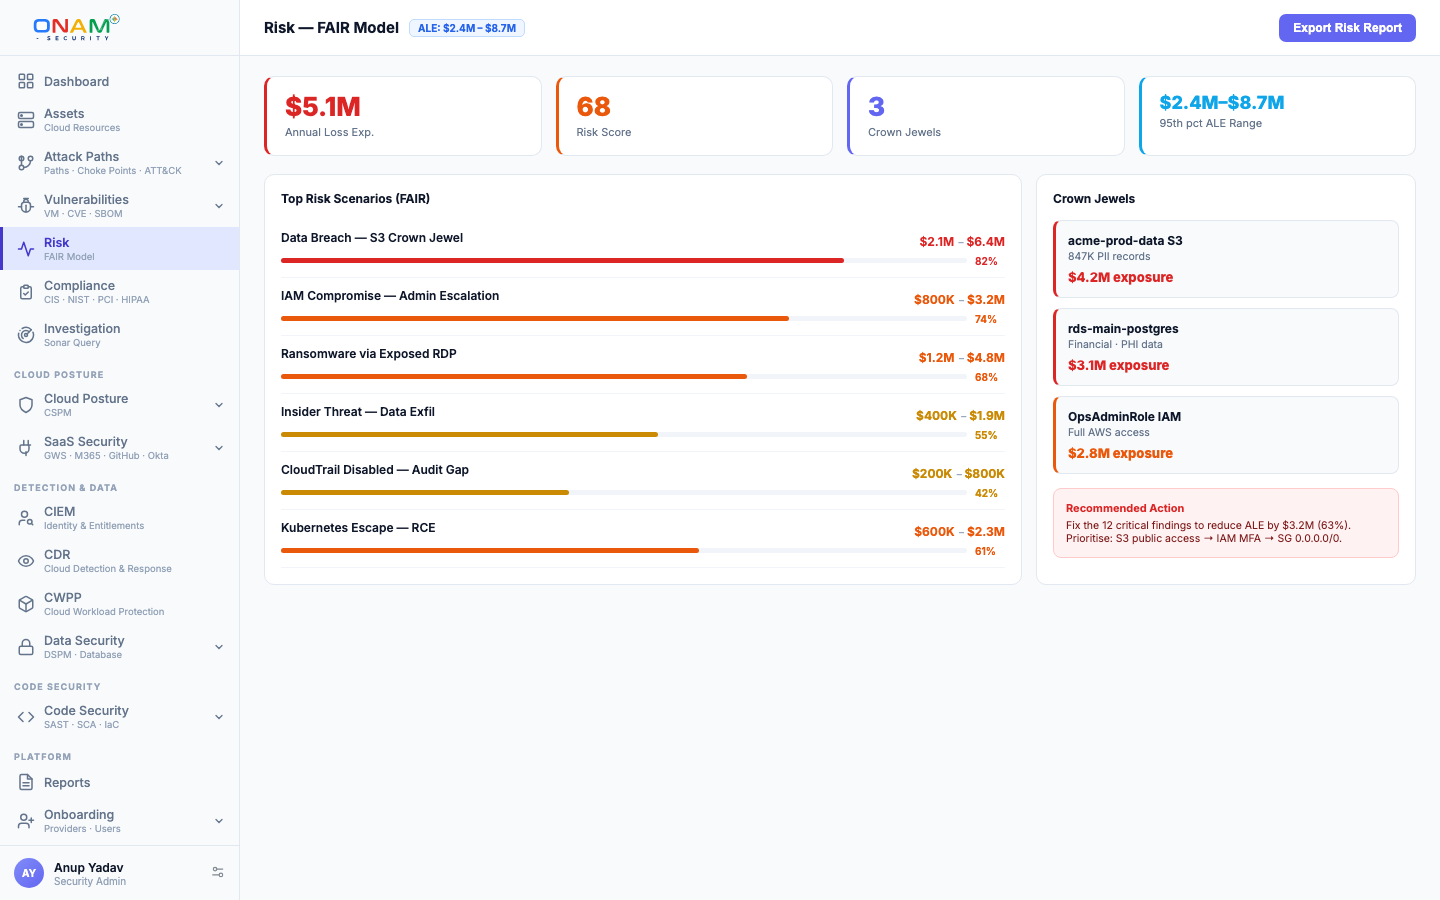
The practical output of FAIR analysis is a dollar-ranked remediation queue. Instead of forty Critical findings and eighty High findings sorted by CVSS, you get a ranked list where each item has:
- Annualised Loss Exposure (ALE) — expected loss per year if this finding is not remediated.
- Remediation cost estimate — person-hours and infrastructure cost to fix.
- Risk reduction ratio — ALE divided by remediation cost: the return on security investment.
- Regulatory exposure — the portion of ALE attributable to regulatory fine risk.
A finding with ALE of $2.4M and a two-hour fix should be done today. A finding with ALE of $15K and three weeks of re-architecture goes on the backlog. A CVSS 9.1 finding on a development sandbox with ALE of $800 should be closed as accepted risk with a documented exception.
This reordering often surprises security teams. The highest-ALE finding is rarely the highest-CVSS finding. It is frequently a Medium-severity misconfiguration — an S3 bucket with misconfigured access logging, an RDS instance missing encryption at rest — on a resource that never received attention because its CVSS score never made it to the top of the queue.
Making the business case to engineering management
Security teams have historically struggled to translate findings into language that resonates with engineering managers and financial stakeholders. "We have a Critical finding" does not answer the question an engineering manager is actually asking: "What is the cost of not fixing this right now compared to shipping the feature we have committed to?"
FAIR makes this conversation tractable. "If this finding is not remediated in the next 30 days, our expected annual loss from this single exposure is $1.8M, of which $600K is attributable to GDPR fine risk. The fix is a two-hour IAM policy change. The return on that two hours is $1.8M in expected loss avoided." That is a conversation an engineering manager can act on.
The goal of FAIR is not to produce a precise dollar figure — the uncertainty ranges in the model make that clear. It is to produce a defensible, data-grounded estimate that turns security prioritisation from an argument about severity scores into a business decision with quantified stakes.