The Scan Pipeline — End to End
This page walks through everything that happens between the moment a scan starts and the moment findings appear in the Onam console: how scans are triggered, how Discovery & Inventory (DI) enumerates your estate, how the 29 engines fan out, how the attack-path graph is built, and how compliance mapping and FAIR risk quantification finish the run.
You will also learn how to schedule scans, run them ad hoc, and watch a live pipeline through the Pipeline Monitor.
Triggers — onboarding, scheduled, and ad hoc
Every scan is a scan run with its own scan_run_id UUID. There are three ways a run starts:
| Trigger | How it starts | Typical use |
|---|---|---|
| Onboarding | Connecting a cloud account validates the credential and immediately kicks off the first full scan | First posture baseline, minutes after connect |
| Scheduled | A schedule attached to the account — daily by default, up to four times per day on Pro plans | Continuous posture monitoring and compliance evidence |
| Ad hoc | The Scans page in the console, or POST /api/v1/scans | Verifying a fix, pre-audit dry runs, incident response |
Schedules are managed in the console under Scans → Schedules or via /api/v1/schedules; individual runs are tracked under /api/v1/scan-runs.
Scans are safe to run at any time, including business hours. Every stage reads from cloud APIs with read-only credentials — nothing executes inside your account and nothing is modified. See Platform data security and tenancy.
The pipeline at a glance
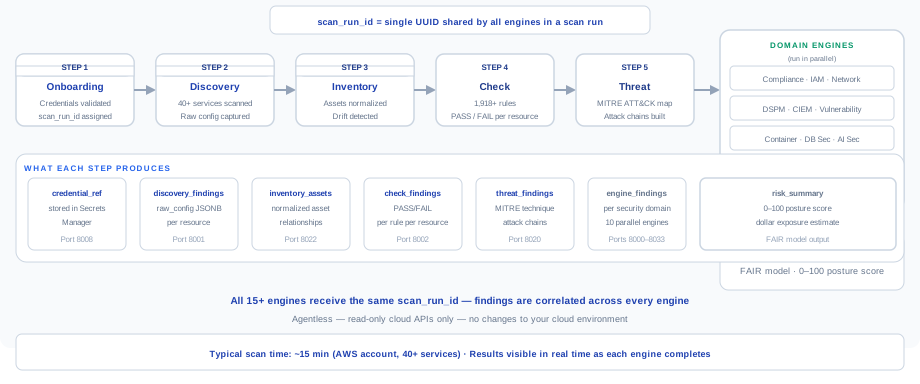
| Order | Stage | Engine(s) | Output |
|---|---|---|---|
| 1 | Credential validation | Onboarding | Verified credential reference; scan_run_id issued |
| 2 | Enumeration & enrichment | Discovery & Inventory (DI) | asset_inventory records and asset_relationships edges |
| 3 | Rule evaluation | Check + Check Engine API | PASS/FAIL per rule per resource across the 9,853-rule posture catalog |
| 4 | Domain fan-out (parallel) | IAM/CIEM, Data Security, Network, Container, Encryption, Database, AI Security, API Security, Vulnerability, Agentless Scanner, CDR, CWPP, CNAPP | Per-domain findings in security_findings |
| 5 | Attack-path graph build | Attack Path v2 | Neo4j graph, confirmed paths, choke-point ranking |
| 6 | Compliance mapping | Compliance | Per-control results and scores across 78 frameworks |
| 7 | Risk quantification | Risk (FAIR, Layer 4) | risk_report, risk_summary, risk_trends |
Every stage receives the same scan_run_id, so every finding, graph edge, compliance result, and risk figure from one run can be correlated — and diffed against the previous run. A typical 40-service AWS account with ~5,000 resources completes in about 15 minutes, and findings stream into the console as each stage finishes.
Stage 2 — Discovery and Inventory (DI)
DI is the foundation every other engine builds on. It runs as a multi-phase enumeration and enrichment process:
- Enumeration — parallel read-only API calls across every covered service and region for the provider: 157 services on AWS, 112 on Azure, 47 on GCP, 42 on OCI, and 51 resource kinds on Kubernetes.
- Enrichment — per-resource configuration detail: policies, encryption settings, tags, public-access flags, attached identities.
- Normalization — every resource becomes a standard record in
asset_inventorywith a globally uniqueresource_uid, and typed edges (containment, attachment, IAM trust, network reachability) are written toasset_relationships. - Drift detection — the new snapshot is compared to the previous scan; created, changed, and deleted assets are tagged.
DI also handles Kubernetes audit-log collection, which feeds the CDR engine's behavioral detection. The result is a queryable inventory — the same one behind the console's Inventory area and the GET /api/v1/inventory/asset/{resource_uid}/blast-radius API.
Stages 3–4 — Rule evaluation and engine fan-out
The Check engine evaluates every applicable YAML rule against the inventory via the Check Engine API — each evaluation produces PASS or FAIL per resource, severity-graded Critical, High, Medium, Low, or Info.
Then the domain engines fan out in parallel, each reading the same inventory snapshot and writing to the same security_findings table:
- IAM / CIEM — effective permissions, unused access, privilege-escalation chains
- Data Security (DSPM) — data-store discovery and PII/PCI/PHI classification
- Network Security — 7-layer exposure model, reachability from the internet
- Container Security — EKS/ECS/AKS/GKE posture, pod security, image scanning, K8s RBAC
- Encryption Security — KMS rotation, TLS certificates, at-rest coverage
- Database Security — RDS, Aurora, DynamoDB, Redshift configuration
- AI Security — Bedrock, SageMaker, Azure OpenAI, Vertex posture
- API Security — gateway and endpoint exposure
- Vulnerability — CVE correlation against NVD, EPSS, CISA KEV, and OSV; SBOM generation
- Agentless Scanner — snapshot-based workload scanning
- CDR — audit-log detection in three tiers: L1 single-event rules, L2 multi-event correlation scenarios, L3 statistical behavior baselines
- CWPP / CNAPP — workload protection and unified posture aggregation
Because every engine emits the same finding contract, the fan-out is invisible in the console — you see one prioritized queue, filterable by engine, severity, account, or resource type. (SecOps code scanning and the Technology Engine's 34 self-hosted technologies run on their own triggers, outside the cloud-account pipeline.)
Stage 5 — Attack-path graph construction
Attack Path v2 loads the scan's assets, relationships, and FAIL findings into a Neo4j property graph, then:
- Derives edges through ~25 catalog-driven derivers — IAM policy analysis, network exposure, security-group rule matching, KMS access, CDR behavioral signals, public-exposure flags.
- Classifies entry points (internet-reachable, anonymously accessible) and crown jewels (sensitive data stores, admin identities) from the catalog.
- Runs BFS traversal from entry points toward crown jewels, accumulating attacker capability along each hop.
- Verifies each edge across five security domains before marking it CONFIRMED — a path is never reported on a single signal.
- Attaches a MITRE ATT&CK technique chain to every hop.
The output includes the Top 5 choke points — single resources whose remediation severs the largest number of attack paths.
Pro tip: triage choke points before individual findings. One choke-point fix routinely eliminates dozens of paths, which moves your posture score and your risk dollar-figure far more than fixing findings in severity order.
Stages 6–7 — Compliance mapping and FAIR risk
Compliance projects the run's findings onto 78 frameworks through the rule-to-control mapping catalog. Each control gets its own pass rate, rolled up to category and framework scores — no separate per-framework scans. Details in Compliance framework coverage.
Risk Quantification runs as Layer 4, after all engines complete, in three steps: ETL (pulls Critical and High findings from the engine outputs), Evaluate (applies the FAIR model), and Report (writes risk_report, risk_summary, and risk_trends).
Risk = LEF x LM
LEF  = TEF x Vulnerability          (Loss Event Frequency)
LM   = Primary + Secondary loss     (Loss Magnitude)
Loss magnitude uses per-record cost benchmarks from the IBM Cost of a Data Breach 2024 study (healthcare $10.93, finance $6.08, technology $4.88, retail $3.28, default $4.45 per record), data-sensitivity multipliers (restricted ×3.0, confidential ×2.0, internal ×1.0, public ×0.1 — tenant-overridable), and a regulatory multiplier where the highest single applicable regulation applies:
| Regulation | Multiplier |
|---|---|
| GDPR | ×1.5 |
| SOX | ×1.4 |
| HIPAA | ×1.3 |
| PCI-DSS | ×1.2 |
| CCPA / APPI / PDPA / PIPEDA | ×1.1 |
The result is a dollar-denominated exposure figure per finding, per asset, and per account — the number your board actually understands.
Watching a scan — console, monitoring, and failure handling
Findings stream into the console as each stage completes — you can start triaging from around minute 5 of a typical run. Results land in the area that matches their engine (Findings, Inventory, Attack Paths, Compliance, Risk), all filtered to the current scan_run_id or aggregated across runs.
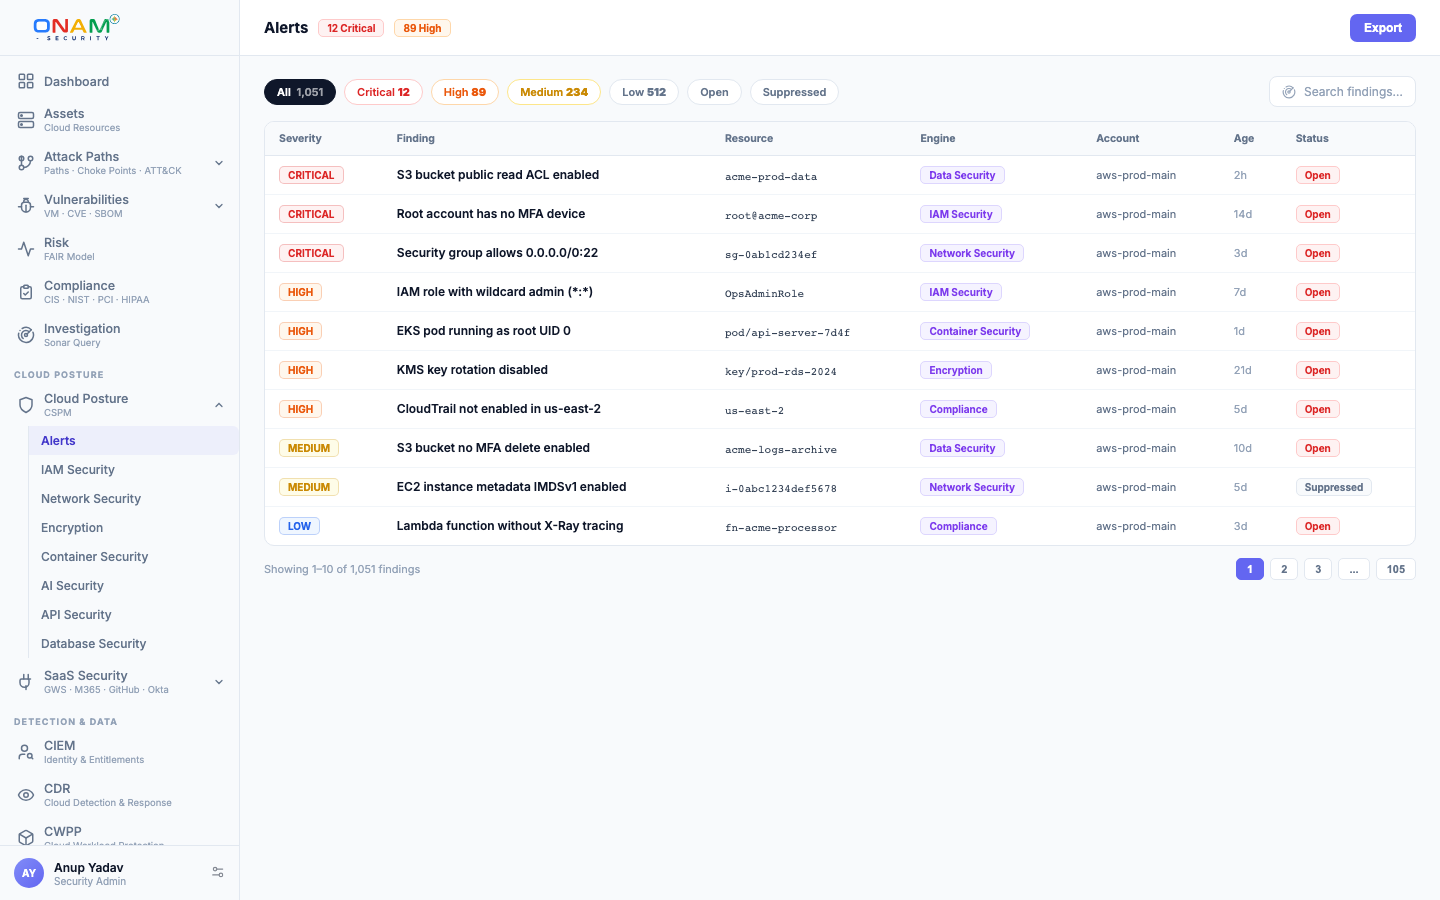
The Pipeline Monitor engine gives you live visibility into every run — per-stage status, timing, and log streaming — in the console under Scans, or via /api/v1/pipeline and /api/v1/scan-runs.
When a stage fails, the pipeline marks it and continues: findings from successful stages are still surfaced, the failure is logged with root-cause context, and you can re-trigger the run without affecting the prior scan's data. Findings auto-resolve on subsequent runs — a finding flips to PASS when the rule no longer triggers, and findings unseen for 30 days are auto-closed.
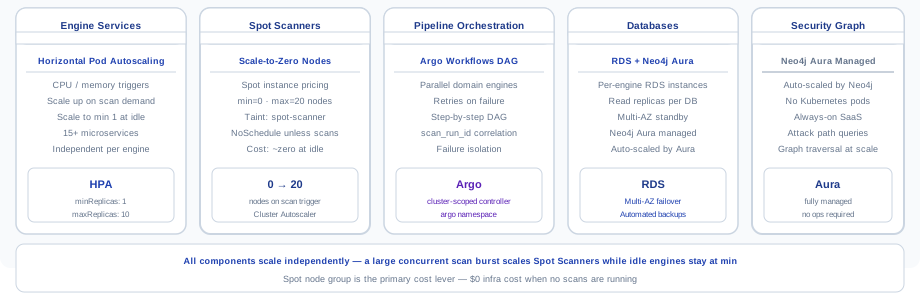
Scanning scales horizontally: enumeration and rule evaluation parallelize per account, per service, and per region, so a 50-account organization scans in roughly the same wall-clock time as a single account. Accounts are always scanned independently — one account's failure never blocks another's results.
Next steps
- Architecture overview — the 29 engines, the data model, and the finding contract
- Platform data security and tenancy — credential handling and read-only enforcement behind every scan
- Compliance framework coverage — how scan results become framework scores and audit evidence
- Book a demo — watch a live scan run end to end