Threat Detection
Onam detects threats on three planes at once: posture rules that find exploitable configuration before an attacker does, behavioral detection that watches audit logs for active attack activity, and correlation that stitches findings and detections into attack paths and incidents. This page explains how the three planes divide the work, how MITRE ATT&CK ties every result together, and how an analyst moves from alert to resolution in the console.
The three detection planes
| Plane | Engine | Input | Output |
|---|---|---|---|
| Posture | CSPM and the domain engines | Resource configuration snapshots | PASS/FAIL findings — what could be exploited |
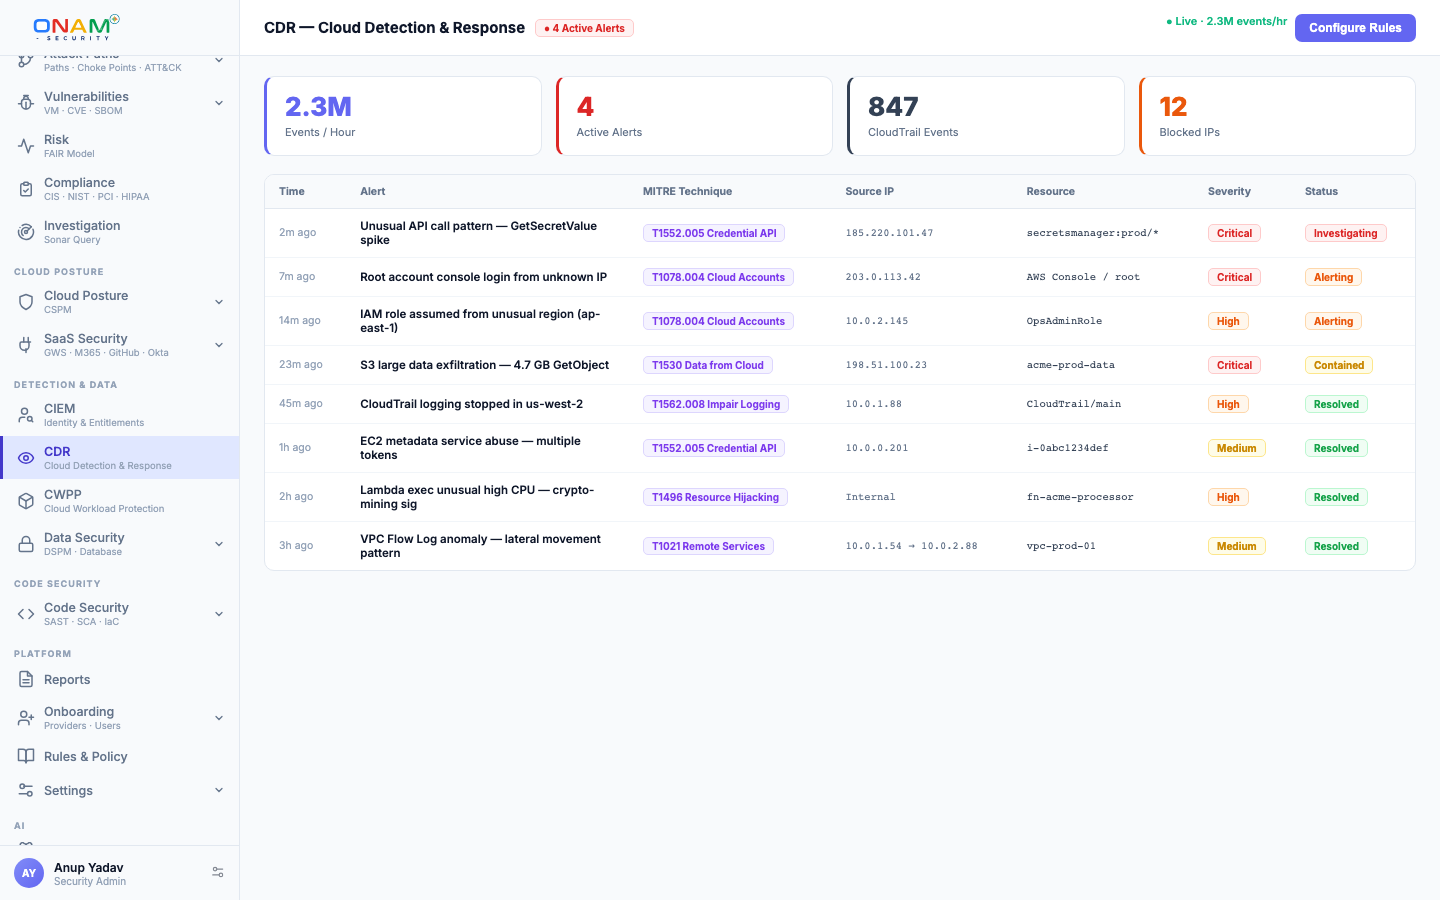
| Behavioral | CDR | Audit and activity logs from all 7 clouds | Detections and incidents — what is being exploited |
| Correlation | Attack Path and Investigation | Findings plus detections | Attack paths, toxic combinations, choke points |
The planes are complementary by design. Posture without behavior tells you where you are weak but not whether anyone is acting on it. Behavior without posture buries you in alerts with no context. Correlation is what turns both into a decision: this detection, on this misconfigured resource, on a confirmed path to a crown jewel — act now.
Posture detection
The posture plane evaluates 10,000+ rules against every resource on every scan across AWS, Azure, GCP, OCI, Alibaba Cloud, IBM Cloud, and Kubernetes. Rules are YAML-defined, deterministic, and binary — PASS or FAIL — so results are reproducible and auditable. Domain engines extend the same model into their specialties: network exposure, data classification, container and Kubernetes posture, encryption, databases, and AI services.
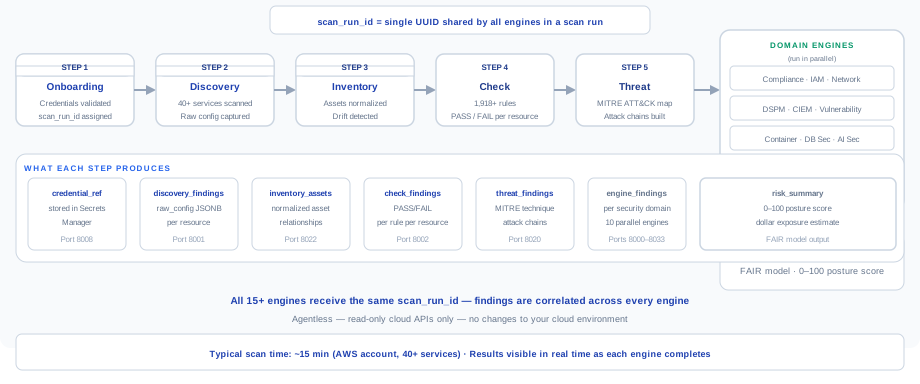
Posture findings are pre-breach signals: a public snapshot, an admin role without MFA, a security group open to the internet. They are ranked by severity (Critical to Info) and feed the risk engine, the compliance engine, and the attack path graph.
Behavioral detection
The behavioral plane ingests audit logs from all seven providers — CloudTrail, Azure Monitor, GCP Cloud Audit Logs, OCI Audit, Alibaba ActionTrail, IBM activity logs, and Kubernetes audit events — and runs a three-tier detection model:
- L1 — single-event rules. One log event matches a known-bad pattern: root login, CloudTrail tampering, privileged pod creation.
- L2 — multi-event correlation scenarios. A sequence of events forms an attack narrative: new key created, used from a new IP, followed by mass data reads.
- L3 — statistical baselines. Per-entity behavioral profiles flag deviations: API rates, active hours, regions, first-touched services.
See CDR for the full detection model, log source configuration, and response playbooks.
Correlation
The correlation plane merges both worlds:
- Behavioral edges on the graph. When CDR observes real movement — an assumption, a data access — it becomes an edge in the attack path graph, upgrading a theoretical path to an active one.
- Toxic combinations. Two Medium findings that together enable a Critical chain are detected and re-scored automatically.
- Choke points. The graph identifies single fixes that sever many paths at once — the highest-leverage remediation available.
- Incidents. Related detections are grouped by shared entities and temporal proximity, so three alerts become one investigation.
MITRE ATT&CK across the platform
MITRE ATT&CK is the common language of every detection plane:
- Every posture rule's metadata carries
mitre_techniquesandmitre_tactics— a failed rule tells you which technique it would enable. - Every CDR detection fires with a technique tag — T1078 Valid Accounts, T1530 Data from Cloud Storage, T1098.001 Additional Cloud Credentials.
- Every attack path hop is tagged with the technique an attacker would use to take it.
The console renders this as an ATT&CK heatmap (GET /api/v1/cdr/heatmap) showing which tactics and techniques your environment is exposed to and where activity has been observed — a single view that answers "where are we weak?" in the vocabulary your SOC already speaks.
Investigation workflow
A typical analyst flow from alert to resolution:
- Triage. Start in the Findings or CDR view, sorted by severity and incident grouping. The finding header shows the affected asset, when it fired, and its MITRE technique.
- Context. Open the finding detail: full description, evidence, related findings on the same asset, compliance impact, and remediation steps.
- Blast radius. Pivot to the asset in Inventory and its blast radius (
GET /api/v1/inventory/asset/{resource_uid}/blast-radius) — what an attacker could reach from here. - Correlate. Check whether the asset sits on an attack path or a choke point; an active detection on a confirmed path is your priority incident.
- Remediate. Apply the finding's remediation steps, or let the Remediation engine generate the fix; route to the owning team via your ticketing integration.
- Verify. The next scan re-evaluates the rule; the finding auto-closes when the fix is confirmed.
Prioritize the intersection, not the volume. A Medium posture finding on a choke point with an active L2 detection outranks a hundred isolated Highs. The correlation plane exists precisely so you can work this way.
Tuning and noise control
- Severity thresholds — alert routing has a minimum-severity gate per channel, so pagers only fire for what matters.
- Suppressions — accepted posture findings are suppressed with justification and expiry, keeping scores honest without deleting evidence.
- Entity allowlists — CDR detections support per-entity allowlisting, for example a role that legitimately operates from many regions.
- Custom rules — the Rule Builder adds tenant-specific posture rules; CDR scenario tuning adjusts behavioral sensitivity.
Next steps
- CDR — the behavioral detection plane in depth
- Attack Path Analysis — the correlation plane in depth
- CSPM — the posture plane in depth
- Book a demo — walk through a live investigation