Quickstart
This guide takes you from nothing to your first triaged Critical finding in about 15 minutes: create an account, connect a cloud with a read-only role, run the first scan, read the dashboard, triage what it finds, and wire findings into the tool your team already watches.
Most of the steps are clicks. The longest wait is the first scan itself — and it streams findings as it runs, so you will usually be reading results before it finishes. A typical 40-service AWS account completes in around 15 minutes; very large accounts take longer.
Before you begin
- An Onam account invitation or sign-up link (your admin, or Book a demo to get one).
- Credentials for the cloud you're connecting — for AWS, permission to create a CloudFormation stack and an IAM role in the target account.
- 15 minutes. No agents to install, no network changes, no maintenance window.
Step 1: Create your account
- Open the Onam console and sign up with your work email, or accept your organization's invite.
- Verify your email and set a password — or use SSO if your organization has SAML configured.
- On first login you land on the onboarding screen with zero connected accounts.
Step 2: Connect your first cloud
Each provider has a dedicated guide: AWS, Azure, Google Cloud, OCI, Alibaba Cloud, IBM Cloud, and Kubernetes. All of them follow the same pattern: create a read-only credential in your environment, hand Onam the reference, never share a long-lived admin key.
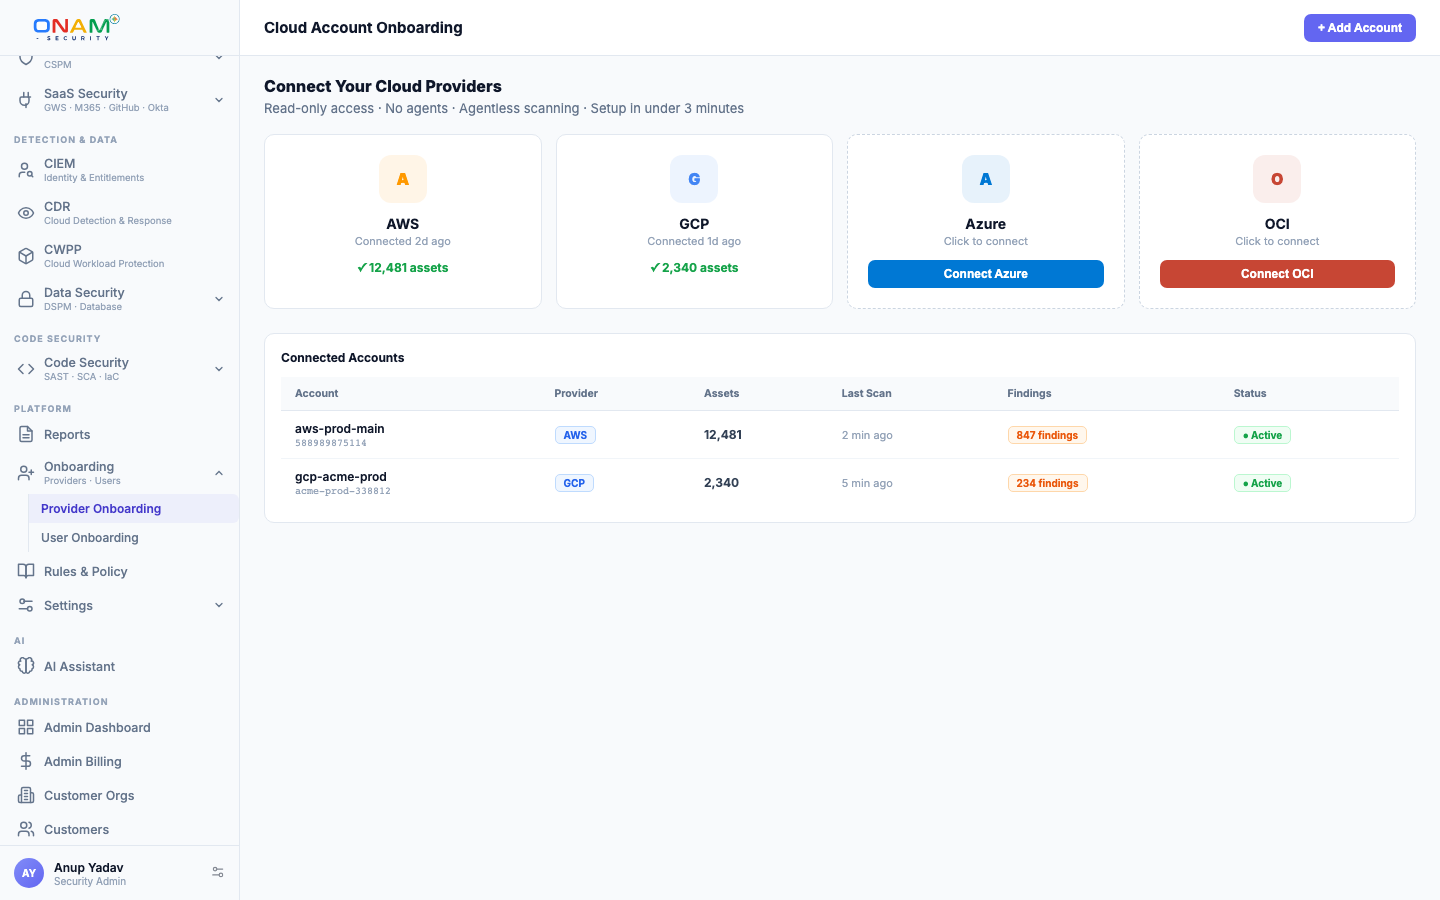
Here is the AWS flow end to end — it is the most common first connection:
- In the console, go to Onboarding, choose Add cloud account, and select AWS.
- Onam generates a CloudFormation quick-create link pre-filled with a unique ExternalId for your tenant.
- Launch the stack in your AWS account. It creates one read-only IAM role whose trust policy only allows Onam's account to assume it — and only when the ExternalId matches.
- Paste the created role ARN back into the console.
- Onam validates the connection with a
sts:AssumeRolecall and stores the role reference in AWS Secrets Manager, encrypted with KMS. No keys ever leave your account.
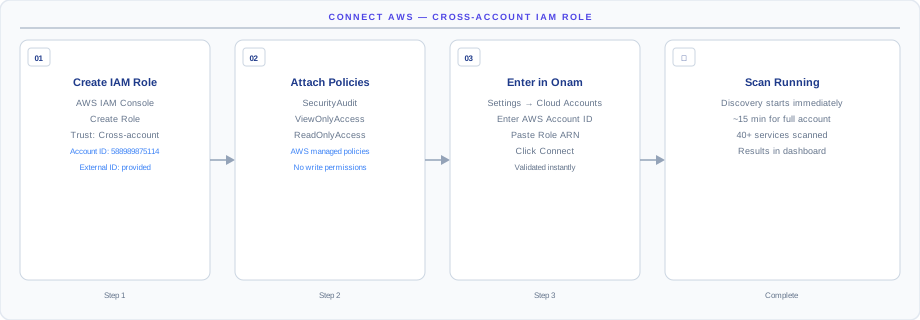
The ExternalId is what prevents the confused-deputy attack — a third party can't trick Onam into assuming your role on their behalf. Don't edit it out of the template, and don't reuse a role created for another vendor. An access-key option exists for AWS, but the role is strongly recommended: it's revocable in one click and grants nothing writable.
Step 3: Run the first scan
The first scan starts automatically once validation passes (you can also trigger one from Scans). Under the hood it runs as an ordered pipeline:
- Credential validation — the role is assumed and its permissions confirmed.
- Discovery and Inventory (DI) — multi-phase enumeration of every resource in the account, written to
asset_inventorywith cross-resource links inasset_relationships. - Rule evaluation — the Check engine evaluates the inventory against the 10,000+ rule registry, producing PASS or FAIL per resource per rule.
- Engine fan-out — the domain engines (CIEM, data security, network, container, vulnerability, and the rest) run in parallel against the same inventory.
- Attack path build — assets, relationships, and findings are loaded into the security graph and traversed from entry points to crown jewels.
- Compliance and risk — findings map onto 78 framework control catalogs, then FAIR risk quantification converts Critical and High findings into dollar exposure.
Watch progress on the Scans page. Findings appear in real time as each stage completes — you don't have to wait for the pipeline to finish.
Step 4: Read the dashboard
When findings start landing, open Dashboard. Four things are worth reading in order:
- Posture score — a 0–100 rollup of your pass rate, weighted by severity. Expect it to look worse than you'd like on day one; everyone's does.
- Findings by severity — counts of Critical, High, Medium, Low, and Info. Only the first two columns should drive today's work.
- Top risks and attack paths — the graph-ranked issues, which are usually a much shorter list than the raw finding count.
- Compliance summary — your starting score per enabled framework.
Step 5: Triage your first Critical findings
- Open Findings and filter to severity Critical.
- Sort or group by rule — ten findings from one rule (say, unencrypted EBS volumes) are one decision, not ten.
- Open a finding. The detail view shows the affected resource, the failed rule, the frameworks it violates, and step-by-step remediation — a CLI command, Terraform snippet, or console walkthrough.
- Check Attack Paths before fixing in ID order: a Medium finding that sits on a path to a crown jewel usually outranks an isolated Critical. Choke points tell you which single fix severs the most paths.
- Fix what's real, and use Suppressions (with a justification and optional expiry) for accepted risks — suppressed findings stay visible to the security team but leave the active queue.
Step 6: Set up an integration
Findings your team never sees don't get fixed. From Notifications and the Integration Catalog:
- Connect Slack or email and route new Critical findings to your security channel.
- Connect Jira to create tickets from findings — assignments and status sync back to the console.
- If you have a SIEM, forward findings via the REST API or a webhook.
Start with one noise-proof route — Critical findings only, one channel. Widen the funnel after the first cleanup week, not before, or the channel gets muted by Friday.
Next steps
- Core Concepts — the mental model behind everything you just clicked through.
- Connect your remaining accounts — coverage gaps are where incidents live; connect all accounts, not just production.
- Attack Path — how path-based prioritization actually works.
- Framework Coverage — enable the frameworks your auditors care about.