SLA & SLO
This document defines the Service Level Agreement (SLA) and Service Level Objectives (SLOs) for the platform. SLAs are contractually committed in your subscription. SLOs are internal performance targets we publish for transparency — they tell you what to expect day to day, even where we are not contractually committing.
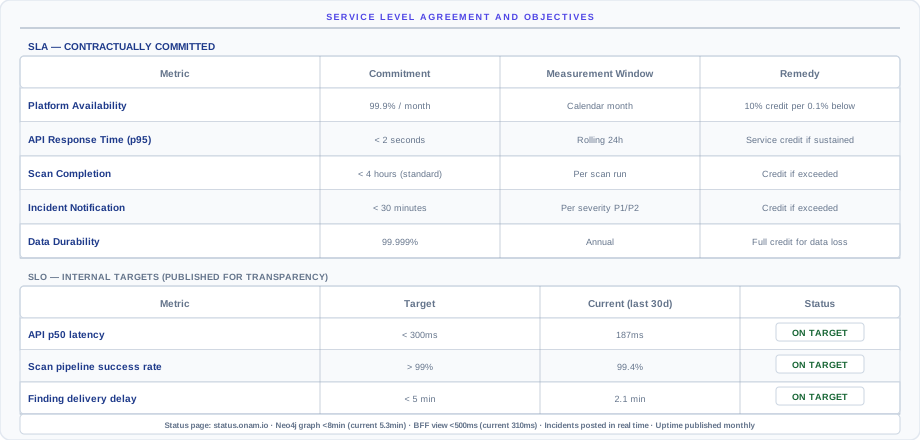
The key distinction: an SLA is a contractual commitment with credit consequences if breached (99.9% uptime, 1-hour critical-incident response). An SLO is a published target without contractual penalty (typical scan completion time, P95 API latency).
Platform uptime SLA
The uptime SLA depends on your subscription plan. Higher-tier plans get tighter commitments and bigger credits if breached.
| Plan | Monthly uptime SLA | Max downtime per month | Credit if breached |
|---|---|---|---|
| Starter | 99.5% | 3h 36m | 10% of monthly fee |
| Growth | 99.9% | 43 min | 25% of monthly fee |
| Enterprise | 99.95% | 21 min | 50% of monthly fee |
| Enterprise+ (negotiated) | Up to 99.99% | Down to 4 min | Up to 100% of monthly fee |
How uptime is measured: synthetic monitors run every 60 seconds from three geographic regions, probing the portal, the API, and the scan trigger endpoint. An outage is declared when 2 of 3 probes fail for 3 consecutive minutes. The 2-of-3 rule prevents a single regional network blip from triggering a false outage.
Excluded from the SLA:
- Scheduled maintenance within the published window (4 hours or less per month, with 48-hour notice)
- Force majeure events (natural disaster, war, government action)
- Customer-caused issues (your IAM role broken on the cloud side, your network blocking us)
- Third-party provider outages beyond our control (cloud provider regional outages, your IdP unreachable)
Credit claims must be submitted within 30 days of the incident to support@onam.io with the incident date and impact description. Credits apply to the next billing cycle.
Scan performance SLOs
Scan duration depends primarily on the number of resources in your cloud account, and secondarily on the number of regions you have enabled. The targets below are published SLOs, not contractual SLAs, unless specified in your enterprise agreement.
| Account size (resources) | Target scan duration | P99 | Notes |
|---|---|---|---|
| Under 1,000 | 15 minutes | 20 min | Single-region accounts |
| 1,000–10,000 | 60 minutes | 90 min | Standard multi-region |
| 10,000–50,000 | 2 hours | 3 hours | Large accounts with many regions |
| 50,000–100,000 | 3 hours | 4 hours | Enterprise-scale |
| Over 100,000 | 4 hours | 6 hours | Requires Enterprise plan |
What counts as "scan complete": all engines (Discovery & Inventory, Check, the domain engines, Attack Path, and Risk) have finished processing and findings are visible in the console.
Findings-to-console latency: under 5 minutes from each engine's completion to findings visible in the UI (P99 under 10 minutes). You don't wait for the full scan — findings stream in as each engine completes.
API performance SLOs
The API is sized to support continuous integration into your existing tooling (SIEM, GRC, dashboards). Latency targets vary by endpoint complexity.
| Endpoint type | P50 | P95 | P99 | Notes |
|---|---|---|---|---|
Gateway health (/gateway/health) | Under 50 ms | Under 100 ms | Under 200 ms | No database query |
| Single resource lookup | Under 200 ms | Under 500 ms | Under 1 s | Indexed query |
| Findings list (paginated, 50 rows) | Under 500 ms | Under 1 s | Under 2 s | Tenant-scoped |
| Compliance posture score | Under 800 ms | Under 2 s | Under 3 s | Aggregate query |
| Dashboard views (BFF aggregation) | Under 1 s | Under 2 s | Under 3 s | Multi-domain aggregation |
| Attack graph traversal | Under 1.5 s | Under 3 s | Under 5 s | Graph database query |
| Compliance report (full export) | Under 5 s | Under 10 s | Under 30 s | Large data export |
Rate limits apply per plan (see the API Reference). Rate-limit headers (X-RateLimit-Remaining, X-RateLimit-Reset) are returned on every response so your client can self-throttle.
Support response SLAs
Support response is governed by severity classification. Severity is set when you submit a ticket; we may upgrade or downgrade it based on observed impact, with notification to you.
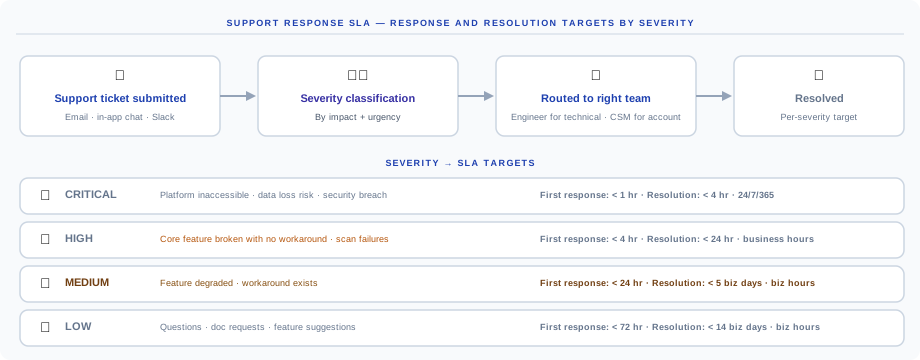
| Severity | Definition | First response | Target resolution | Coverage |
|---|---|---|---|---|
| Critical | Platform inaccessible · data loss risk · security breach | Under 1 hour | Under 4 hours | 24/7/365 |
| High | Core feature broken with no workaround · scan failures | Under 4 hours | Under 24 hours | Business hours |
| Medium | Feature degraded · workaround available | Under 24 hours | Under 5 business days | Business hours |
| Low | Questions · documentation requests · feature suggestions | Under 72 hours | Under 14 business days | Business hours |
Business hours: Monday–Friday, 09:00–18:00 in your account's primary support region (default IST, configurable for Enterprise).
Critical and High coverage is 24/7/365 for Growth and Enterprise plans.
Support channels: email at support@onam.io · in-app chat (Growth and Enterprise) · dedicated Slack Connect channel (Enterprise).
Scheduled maintenance
The platform schedules maintenance windows during low-traffic hours. Maintenance does not count against the uptime SLA provided proper notice is given.
| Window | Schedule | Max duration | Notice |
|---|---|---|---|
| Weekly | Sunday 02:00–04:00 UTC | 2 hours | 24 hours via status page |
| Monthly | Last Sunday of month, 02:00–06:00 UTC | 4 hours | 72 hours via email and status page |
| Emergency | As required (security-critical patches) | Varies | As soon as possible — email and status page |
The weekly window is applied if needed and skipped if not — most weeks pass without maintenance. The monthly window is reserved for larger updates (schema migrations, dependency upgrades).
Subscribe to maintenance and incident notifications at status.onam.io — the status page also carries real-time platform status and incident history, with email or SMS alerts available.
SLO measurement and reporting
We measure uptime and latency continuously via synthetic monitoring and report results to you monthly. The same metrics drive on-call paging, incident declaration, and post-incident reviews.
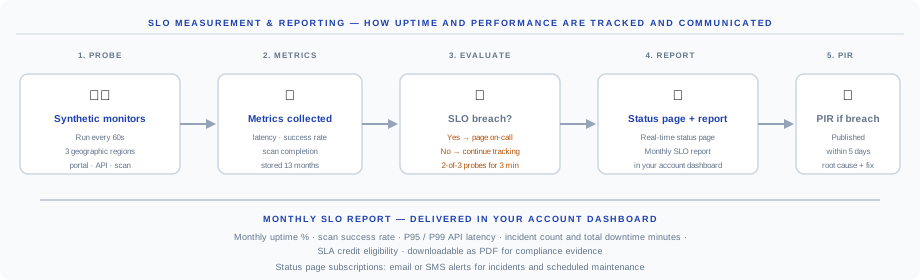
The five-stage measurement pipeline:
- Probe — synthetic monitors run every 60 seconds from 3 geographic regions, hitting the portal, the API, and the scan trigger endpoint.
- Collect — latency, success rate, and scan completion times are stored for 13 months as SLA evidence.
- Evaluate — SLO breach detection (2-of-3 probes failing for 3 minutes) pages on-call automatically.
- Publish — a real-time status page for transparency, plus a monthly SLO report delivered in your account dashboard.
- Review — a post-incident review is published within 5 days of any major incident, including root cause and prevention measures.
Monthly SLO report
Available in your account under Settings → SLO Report. It includes:
- Uptime percentage for the month
- Scan success rate (scans that completed without error)
- P95 / P99 API response times
- Incident count and total downtime minutes
- SLA credit eligibility
- A downloadable PDF for compliance evidence
Enterprise SLA addendum
Enterprise plans can negotiate custom SLA terms. Common customizations:
| Customizable term | Default | Enterprise range |
|---|---|---|
| Uptime SLA | 99.95% | Up to 99.99% |
| Credit percentage | 50% | Up to 100% |
| Support response (Critical) | Under 1 hour | Under 15 minutes |
| Dedicated support engineer | No | Yes |
| Custom maintenance window | No | Yes |
| Data residency | Account default | EU-only · US-only · Government cloud |
| Scan frequency | Daily | Up to hourly |
| SLA reporting | Monthly in-app | Monthly plus quarterly review call |
Contact sales@onam.io to discuss Enterprise SLA terms.
SLAs are subject to the Master Service Agreement (MSA). In case of conflict, the MSA governs. For SLA credit claims: support@onam.io. Effective 2026-01-01, last reviewed 2026-05-09.Next steps
- Trust Center — certifications, incident response, and business continuity targets
- Data Retention — retention windows and deletion guarantees
- API Reference — rate limits and the endpoints these SLOs cover
- Book a demo — discuss Enterprise SLA terms with our team